Stats 340
Discrete Distribution
and
Uniform Distribution
For interval
Bernoulli Distribution
Definition
A Bernoulli distribution is a discrete probability distribution for a random variable which takes the value 1 with success probability of
Probability Mass Function
The probability mass function (pmf) of a Bernoulli random variable
Expectation and Variance
The expectation (mean) of a Bernoulli random variable
Example
Let's consider a simple example of flipping a coin. If we define success as the coin landing heads up, and if the coin is fair, then the success probability $ p $ is 0.5. The Bernoulli distribution can model this experiment.
R Code
# Define the probability of success
p <- 0.5

# Simulate one Bernoulli trial
trial <- rbinom(1, size = 1, prob = p)

# Print the result
cat("The result of the Bernoulli trial is:", trial, "\n")
Binomial Distribution
Definition
The Binomial Distribution is a discrete probability distribution that describes the number of successes in a fixed number of independent trials, with each trial having only two possible outcomes (commonly referred to as "success" and "failure"). The parameters of a binomial distribution are
Certainly! Let's add the general probability equations for both the Binomial Distribution and the Geometric Distribution, using LaTeX for clear mathematical representation.
General Probability Equation
The probability of getting exactly
where:
is the probability of getting exactly successes, is the binomial coefficient, which calculates the number of ways to choose successes from trials, is the probability of success on a single trial, is the probability of failure on a single trial.
and
Example
Suppose we want to find the probability of getting exactly 3 heads in 5 tosses of a fair coin.
Here, the number of trials (
R Code
# Define the parameters
n <- 5       # Number of trials
p <- 0.5     # Probability of success on each trial
x <- 3       # Number of successes

# Calculate the probability
probability <- dbinom(x, size = n, prob = p)

# Print the result
cat("The probability of getting exactly 3 heads in 5 tosses of a fair coin is:", probability, "\n")
In R, the rbinom function is used to generate random variates from a binomial distribution. This can be useful for simulation purposes or to understand the distribution of outcomes under specified conditions (number of trials and probability of success).
Example
Let's simulate the outcome of 10 experiments, each consisting of 5 tosses of a fair coin, and count the number of heads (successes) in each experiment.
R Code
# Define the parameters
n <- 5       # Number of trials in each experiment
p <- 0.5     # Probability of success on each trial
experiments <- 10  # Number of experiments

# Generate random variates
random_variates <- rbinom(experiments, size = n, prob = p)

# Print the results
cat("Random variates from 10 experiments of 5 coin tosses each:", random_variates, "\n")
Geometric Distribution
Definition
The Geometric Distribution is a discrete probability distribution that models the number of trials needed to achieve the first success in a series of independent and identically distributed Bernoulli trials, where each trial has only two possible outcomes (success or failure). The parameter of a geometric distribution is
Geometric Distribution
General Probability Equation
The probability that the first success occurs on the
where:
is the probability that the first success occurs on the th trial, is the probability of success on each trial, is the probability of failure on each trial, is the trial number of the first success.
Theis and is also
Example
Suppose we want to find the probability that the first success (e.g., first head) occurs on the 4th toss of a fair coin.
Here, the probability of success (
R Code
# Define the parameters
p <- 0.5     # Probability of success on each trial
x <- 4       # The trial on which the first success occurs

# Calculate the probability
probability <- dgeom(x - 1, prob = p) # x - 1 because dgeom counts the number of failures before the first success

# Print the result
cat("The probability of the first head occurring on the 4th toss is:", probability, "\n")
The rgeom function in R is used to generate random variates from a geometric distribution. This function can simulate the number of trials required to obtain the first success in a series of independent trials, each with the same probability of success.
Example
Let's simulate 10 scenarios to find out how many trials are needed to achieve the first success (e.g., first head) when tossing a fair coin.
In this simulation, the probability of success (getting a head) on each trial is 0.5.
R Code
# Define the parameters
p <- 0.5     # Probability of success on each trial
scenarios <- 10  # Number of scenarios to simulate

# Generate random variates
random_variates <- rgeom(scenarios, prob = p) + 1 # +1 because rgeom returns the number of failures before the first success

# Print the results
cat("Number of trials needed for the first success in 10 scenarios:", random_variates, "\n")
Poisson Distribution
Definition
The Poisson Distribution is a discrete probability distribution that expresses the probability of a given number of events occurring in a fixed interval of time or space, assuming that these events occur with a known constant mean rate and independently of the time since the last event. The parameter of the Poisson distribution is
General Probability Equation
The probability of observing
where:
is the probability of observing exactly events, is the average number of events in an interval, is the base of the natural logarithm (approximately 2.71828), is the factorial of .
Theis and is also
Example
Suppose we want to find the probability of receiving 2 calls in a 1-hour period at a call center, given that the call center receives an average of 5 calls per hour.
Here,
R Code for the Example
# Define the parameters
lambda <- 5  # Average rate (mean) of occurrences
k <- 2       # Number of events

# Calculate the probability
probability <- dpois(k, lambda)

# Print the result
cat("The probability of receiving 2 calls in a 1-hour period is:", probability, "\n")
Example for rpois
Let's simulate the number of calls received in 10 different 1-hour periods at the call center, with an average rate of 5 calls per hour.
R Code for rpois
# Define the parameters
lambda <- 5  # Average rate (mean) of occurrences
periods <- 10  # Number of periods to simulate

# Generate random variates
random_variates <- rpois(periods, lambda)

# Print the results
cat("Number of calls received in 10 different 1-hour periods:", random_variates, "\n")
Long-run Averages
More formally, if
- Note that this set could be finite or infinite.
- If the set is infinite, the sum might not converge, in which case we say that the expectation is either infinite or doesn't exist. But that won't be an issue this semester.
Independence
Definition
In probability theory, two events are said to be independent if the occurrence of one event does not affect the probability of occurrence of the other event. In other words, events A and B are independent if and only if:
This can also be extended to random variables. Two random variables X and Y are independent if the occurrence of a particular value of X does not affect the probability distribution of Y, and vice versa.
Conditional Probability
Definition
Conditional probability is a measure of the probability of an event occurring given that another event has already occurred. If the event of interest is
provided that
Bayes' Rule
Definition
Bayes' Theorem is a way of finding a probability when we know certain other probabilities. The formula is:
where from
This theorem allows us to update our prior beliefs (the probability of
Expectation
If
and
Variance
Now, the first and last terms there are the variances of
So
This term might be familiar to you—it is (two times) the
Now, if
Correlation
Type Error I and II
| Accept |
True Negative ✅ | False Negative ❌ (Type II) |
| Reject |
False Positive ❌ (Type I) |
True Positive ✅ |
- A Type I error corresponds to rejecting the null hypothesis when it is in fact true. That is, type I errors correspond to “false alarms”.
- A Type II error corresponds to accepting the null hypothesis when it is not true. That is, type II errors correspond to “misses”.
Example
| Accept |
41 | 8 |
| Reject |
19 | 32 |
| Type I Error: $P(rej | H_0 true) = \frac{19}{60}$, Type II Error: $P(acpt | H_0 false) = \frac{8}{40}$ |
| Power: $P(rej | H_A) = \frac{32}{40}$ |
Relations
- Increasing
(making the test more liberal in rejecting the null hypothesis) can decrease (reducing the risk of a Type II error), thus increasing the power of the test. - Decreasing
(being more conservative about rejecting the null hypothesis) increases (higher risk of missing an effect), thus reducing the power of the test. - To increase power (reduce
) without changing
Monte Carlo Method
To (approximately) compute
- generate lots of
of , say for some number of Monte Carlo replicates. - Count how many of these replicates correspond to event
occurring. That is, how many are there such that . - Estimate
as .
Example
Note that we have specified the standard deviation to be
Our event of interest is
So we should generate lots of copies of
# the function examine happened or not
event_E_happened <- function( x ) {
  if( 0 <= x & x <= 3 ) {
    return( TRUE ) # The event happened
  } else {
    return( FALSE ) # The event DIDN'T happen
  }
}

# Now MC says that we should generate lots of copies of X...
NMC <- 1000; # 1000 seems like "a lot".
results <- rep( 0, NMC ); # We're going to record outcomes here.
for( i in 1:NMC) {
  # Generate a draw from the normal, and then...
  X <- rnorm( 1, mean=1, sd=sqrt(3) );
  # ...record whether or not our event of interest happened.
  results[i] <- event_E_happened(X);
}
# Now, compute what fraction of our trials were "successes" (i.e., E happened)
sum(results)/NMC
As the number of replications increases, the standard error decreases, which can lead to a smaller p-value and a higher probability of rejecting the null hypothesis when it is false, thus improving the power of the test.
Power of Hypothesis Test
The power of a hypothesis test is the probability of rejecting the null.
CDF, PDF, Inverse CDF, Probability
Probability Density Function (PDF)
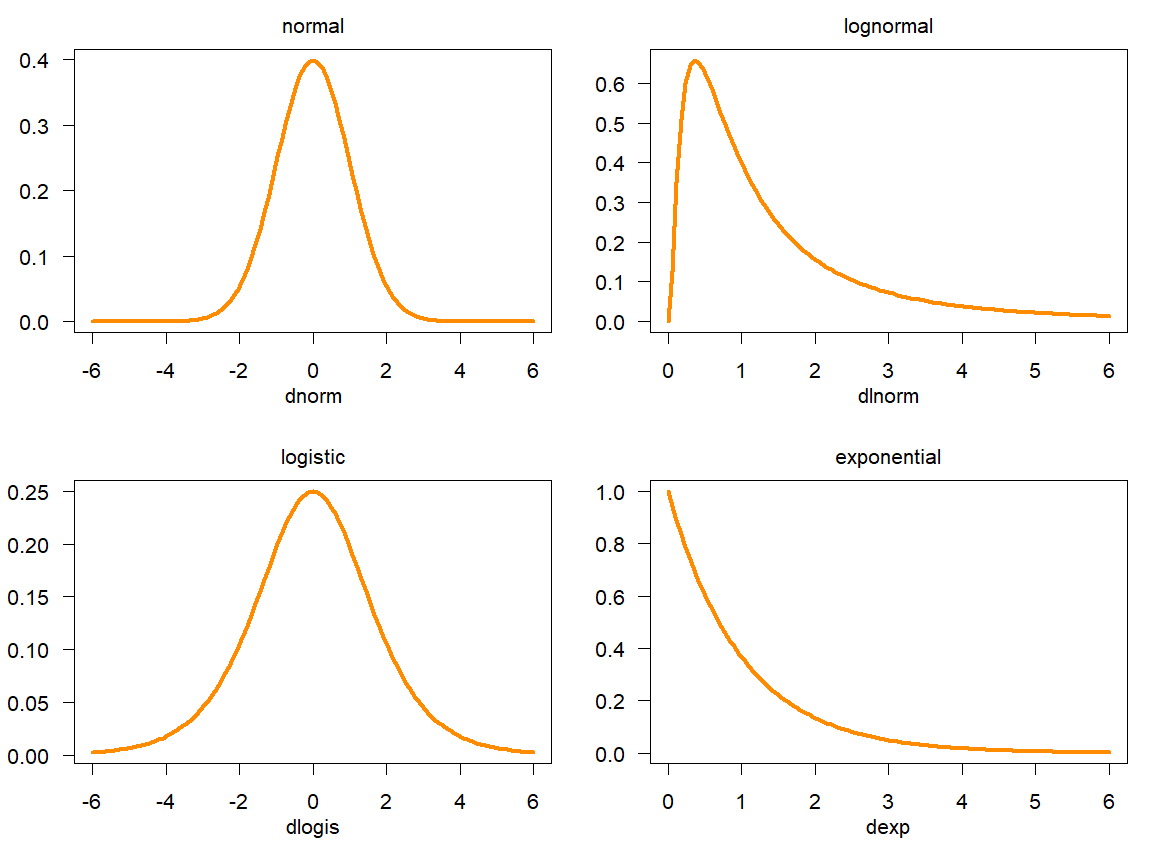
For continuous function there is no probability at a point
Cumulative Distribution Function (CDF)
Inverse CDF
Also known as the quantile function. For any CDF function qx(0.5) (inverse CDF) is qx(0.5)= sqrt(0.5).
Law of Large Numbers
According to the LLN, as the number of trials or sample size increases, the sample mean (average of the sample outcomes) will converge to the expected value (true mean) of the population from which the samples are drawn, provided that the expected value exists.
Convergence of Sample Mean to True Mean
The Law of Large Numbers states that as the sample size
This means that for a sufficiently large
Scaling of the Variance of the Sample Mean with Sample Size
The variance of the sample mean decreases as the sample size increases. Specifically, if
As the sample size increases, the variance of the sample mean decreases, making the sample mean a more precise estimator of the population mean.
Sample Mean and Variance
Sample Mean
And
If
Odd
The odds of an event is defined as the ratio of the probability of the event happening to the probability of the event not happening. Mathematically, if
Estimation
Estimators
The estimator in this case is the sample mean, which is a method used to estimate the population mean. The formula for the sample mean
where
Estimate
If the heights of the 50 students are measured and the resulting values are 160 cm, 165 cm, 170 cm, etc., you would plug these values into the formula to compute the sample mean. This computed value is the estimate of the population mean.
Statistic
In this scenario, the sample mean
Expectation and Variance
The Central Limit Theorem
It explains why many distributions in nature tend to approximate the normal distribution, even if the underlying distribution itself is not normal, provided that the sample size is large enough.
Key Elements of the CLT
- Independent and identically distributed (i.i.d.): The observations in the sample must be independent of each other and come from the same distribution.
- Sufficiently large sample size
Mathematical Formulation
If
will have a distribution that approaches a normal distribution with mean
where
Fact
a higher confidence level demands a wider interval, since
Residual Sum of Squares (RSS) or (SSR)
The RSS is calculated by taking the sum of the squares of the residuals (the differences between the observed values and the predicted values). Mathematically, it can be expressed as:
Why RSS
The RSS measures the variance left unexplained by the model, thus providing a direct measure of the model’s predictive power. Lower RSS values indicate a model that closely fits the data. Sensitivity to Large Errors: Squaring the residuals has the effect of heavily penalizing larger errors.
Example
Consider a dataset where we want to predict house prices based on the size of the house (in square meters).
# Fit linear model
model <- lm(house_price ~ house_size, data = data)
# Get summary of the model
summary(model)
Then calculate the RSS
# Calculate RSS
rss <- sum(residuals(model)^2)
print(rss)
Suppose your output from R looks like this:
- RSS: 12000
- R-squared: 0.85
This would mean: - The model has a fairly low RSS, suggesting it fits the data reasonably well, but there might still be some variability left unexplained.
- An R-squared of 0.85 is quite high, indicating a good predictive model for house prices based on house size.
Linear Regression
Estimate of
To minimize the loss to get the estimates:
Variance of estimates
After fitting, we can find our predicted
the model residuals
Mean Squared Error:
The formula for the 95% confidence interval is: Estimate
Standard Error (
Formula:
Linear Regression Assumption
The response variable has a linear relationship with the predictor variables;
Linear regression assumes that the errors (residuals) follow a normal distribution with mean zero;
The errors have constant variance;
Interaction Term
# here (Type * Treatment) is the interaction
model <- lm(response ~ Type * Treatment + conc, data = data)
The Estimate is the coefficient of relation. For example:
Type -> -9.38 1.62
Treatment -> -3.58 1.85
conc -> 0.0177 0.0022
Type:Treatment -> -6.55 2.61
- When Type = 0 and Treatment = 0, the interaction term has no effect on the response variable.intercept (27.620528)
- When Type = 1 and Treatment = 0, the effect on the response variable is the coefficient of Type (-9.380952).
- When Type = 0 and Treatment = 1, the effect on the response variable is the coefficient of Treatment (-3.580952).
- When Type = 1 and Treatment = 1, the effect on the response variable is the Intercept + TypeMississippi + Treatmentchilled + TypeMississippi:Treatmentchilled = 27.620528 + (-9.380952) + (-3.580952) + (-6.557143) = 8.101481
Expected response = Intercept + TypeMississippi * 1 + Treatmentchilled * 0 + conc * 500 + TypeMississippi:Treatmentchilled * (1 * 0)
Expected response = 27.620528 + (-9.380952) * 1 + (-3.580952) * 0 + 0.017731 * 500 + (-6.557143) * (1 * 0)
Fact: The intercept, also known as the constant term, is the expected value of the response variable when all predictor variables are equal to zero.
Proportion of the change
proportion of the change in response that is explained by the change in predictors, check the R-squared.
- Multiple R-squared: 0.7072
- Adjusted R-squared: 0.6923
Thus, the 70.72% is the one.
Which predictors are the most significant in this model
Check the p-value the smallest one is the target.
Multiple Regression
Multiple regression is an extension of simple linear regression that allows you to predict an outcome based on multiple predictors.
Multiple Regression Model
In a multiple regression model, the formula looks like this:
Example
# Fit multiple regression model
model <- lm(house_price ~ house_size + num_bedrooms + age_of_house, data = data)
# Get summary of the model
summary(model)
Model Fit with RSS
We define the residual sum of squares. Let
or
where, as a reminder,
where
MSS
sum of squares: the sum of squares between our model and the “dumbest” model:
This quantity is often called the model sum of squares (MSS) or the explained sum of squares (ESS).
Since the
Quadratic Term (Nonlinear transformations)
let’s look in particular at mpg (miles per gallon) and hp (horsepower).
mtc_lm <- lm( mpg ~ 1 + hp, data=mtcars );
and you can get quadratic term
mtc_lm <- lm( mpg ~ 1 + hp + I(hp^2), data=mtcars );
Notice that to get our non-linear term hp^2 into the model, we had to write our formula as mpg ~ 1 + hp + I(hp^2). If we just wrote mpg ~ 1 + hp + hp^2, R would parse hp^2 as just hp. I(...) prevents this and ensures that R doesn’t clobber the expression inside.
Logistic Regression
We do that using the logistic function and Sigmoid function
Logistic regression in R
pima_logistic <- glm( diabetes ~ 1 + glu, data=Pima.te, family=binomial );
summary(pima_logistic)
Model Coefficients
The odds of an event E with probability p are given by
So, let’s suppose that we have a logistic regression model with a single predictor, that takes predictor
The odds associated with this probability are
If we look at the log odds associated with our logistic regression model,
How to predict the log-odds:
Predicted log-odds = Intercept + Pclass2 * 0 + Pclass3 * 0 + Sexmale * 1 + Age * 20
where question is set class=1, male=1 and age=20.
Validation Sets
The Mean Squared Error (MSE):
Model Selection
RIDGE Regression
the short answer is that ridge regression (and other shrinkage methods) prevents over-fitting.
LASSO Regression
Lasso Regression aims to minimize the sum of squared residuals plus a penalty term that is proportional to the absolute value of the coefficients (L1 norm). Lasso Regression is beneficial when you have a large number of features and suspect that only a few of them are relevant. It automatically performs feature selection and produces a more interpretable model.
AIC (Akaike Information Criterion)
AIC is used for comparing and selecting models based on their relative quality, considering both the goodness of fit and the complexity of the model. It is particularly useful when you have multiple models with different numbers of predictors and want to choose the best model among them.
R-squared (
R-squared measures the proportion of variance in the response variable that is explained by the predictors in the model. It is commonly used to compare models with the same number of predictors.
Adjusted R-squared
Adjusted R-squared is a modified version of R-squared that adjusts for the number of predictors in the model. Adjusted R-squared is useful when you want to compare models with different numbers of predictors.